On 6 February last, the Commission published its Communication Securing our future: Europe’s 2040 climate target and path to climate neutrality by 2050 building a sustainable, just and prosperous society. The Communication proposes a Union-wide, economy-wide 2040 target reaching 90% net GHG emissions reduction compared to 1990 levels “that will put the EU on an effective, cost-efficient, and just trajectory towards climate neutrality by 2050, as called for under the European Climate Law”.
In fact, what the Climate Law calls for is ambiguous. In recital (30), the Commission should propose a Union intermediate climate target for 2040, as appropriate, at the latest within six months of the first global stocktake carried out under the Paris Agreement and which was concluded at COP28 in Dubai in December 2023. But in the text of the Law, Article 4(3) states that the Commission “at the latest within six months of the first global stocktake … , the Commission shall make a legislative proposal, as appropriate, based on a detailed impact assessment, to amend this Regulation to include the Union 2040 climate target, ..’. There is a difference between proposing a target and making a legislative proposal.
The Commission Communication proposes a climate target for 2040, but it is not a legislative proposal. The Commission has stated that a legislative proposal will not be forthcoming until after the European Parliament elections and a new Commission takes office. The 2040 target, once agreed, will be the basis of the EU’s new Nationally Determined Contribution (NDC) under the Paris Agreement, to be communicated to the UNFCCC by 2025, ahead of COP30 in Brazil in November 2025. This will be a tight legislative schedule to complete.
The Climate Law also requires the Commission, when making this legislative proposal, to publish the projected indicative Union greenhouse gas budget for the 2030-2050 period, taking into account the advice of the European Scientific Advisory Board for Climate Change as well as the best available science.
We should understand what the Communication and in particular the important Impact Assessment that accompanies the Communication sets out to do. It examines different levels of ambition for the 2040 target (three scenarios are examined) and the associated sectoral pathways that are, in principle, consistent with achieving net zero emissions by 2050. “The impact assessment uses economic modelling to analyse the evolution of sectoral emissions and the contribution of technologies that are necessary to meet different 2040 target levels and climate neutrality by 2050” (IA Part 1, p. 25). These scenarios are assessed under two main dimensions: on the one hand the GHG budget measuring the climate performance of the target and the fairness of the contribution of the EU to the global climate agenda and, on the other hand feasibility, including costs, technological deployment and trade-offs.
The impact assessment is a vision document. It is a model-based exercise that looks at the feasibility and associated carbon budget implications of differing 2040 targets. As the Communication notes: “It does not propose new policy measures or set new sector-specific targets”. The impact assessment notes in several places that the model-based analysis is a technical exercise based on a number of assumptions that are shared across scenarios, and that its results do not prejudge the future design of the post-2030 policy framework. The model runs produce a set of pathways with different sectoral trajectories, but these are not the result of any optimising or deliberative process. They are the outcome of scenarios that the modellers themselves decided to examine.
Instead, the different target options are evaluated according to their ability to deliver on the following seven specific objectives: SO1, ensure that climate neutrality is delivered; SO2 minimise the EU’s GHG budget; SO3 ensure that the transition is just; SO4 ensure that the long-term competitiveness of the EU economy is maintained; SO5 provide predictability for the deployment of best-available, cost-effective, and scalable technologies; SO6 ensure the security of supply of energy and resources, and SO7 ensure environmental effectiveness.
There was a deal of agitation when the final Communication was compared with a leaked draft that had previously been circulating in Brussels. It was suggested that the earlier draft had contained a reduction target for agricultural emissions which was omitted in the final Communication. The inference was drawn that this exclusion was another climbdown by the Commission in the light of the various farmer protests.
Leave aside for a moment that any Commission Communication will go through several drafts and we have no idea how early in the process the leaked draft made its appearance – certainly, much of the text was altered as compared to the final version and not only the reference to feasible reductions in agricultural emissions. Further, there is no agricultural pillar as yet under the EU’s climate architecture, so the question of setting a specific agricultural target does not arise.
The text included in the leaked draft and omitted in the final Communication reads: “.. with the right policies and support, it should be possible both to reduce non-CO2 GHG emissions in the agriculture sector by at least 30% in 2040 compared to 2015…. This would mean that the EU’s combined agriculture and forestry sectors could become climate neutral as early as 2035”. The sentence refers to a feasible reduction without specifically making it a target. Setting an agricultural target would be desirable, and a 30% reduction in agricultural emissions by 2040 relative to 2015 may be an appropriate level of ambition. But these are arguments for another day.
Three potential 2040 targets examined
The impact assessment considers three 2040 targets or scenarios.
Scenario 1 (S1) is a reduction of up to 80% compared to 1990. This is consistent with a linear trajectory between 2030 and 2050 (as referred to in Article 8 of the European Climate Law). In fact, it is even less ambitious than the expected reduction impacts of a continuation of the current Fit for 55 package for energy and industrial emissions beyond 2030, which on its own is expected to result in a 88% reduction in EU net emissions by 2040. This scenario does not assume specific mitigation of non-CO2 emissions beyond their default evolution within the current framework, for instance in agriculture, or in the LULUCF sector.
Scenario 2 (S2) is a reduction of 85-90% compared to 1990. This scenario combinesthe energy trends reflected in S1 with a further deployment of carbon capture and e-fuels as well as substantial reductions of GHG emissions in the land sector, including non-CO2 emissions in the agriculture sector and carbon removals in the LULUCF sector.
Scenario 3 (S3) is a reduction of 90-95% compared to 1990. This scenario builds on S2 and relies on a fully developed carbon management industryby 2040, with carbon capture covering all industrial process emissions and delivering sizable carbon removals, as well as higher production and consumption of e-fuels than in S2 to further decarbonise the energy mix.
To ensure comparability across target options, the three scenarios share the same key socio-economic assumptions (in terms of population, economic activity, industrial production, and food production), technology costs, and common “default” policy elements applying post-2030 (IA, Part 1, p. 29). What is worth highlighting here is that food production appears to be held constant across the three scenarios, despite the very different trajectories for agricultural emissions in each scenario. This is a very puzzling assumption, one to which I return later in the post.
The scenarios mainly differ with respect to the uptake over 2030-2040 of novel technologies to meet different levels of net GHG emissions in 2040. These technologies include, among others, advanced biofuels and the development of lignocellulosic bioenergy crops, precision agriculture, e-fuels, and the development of a carbon management industry. S1 largely leaves the deployment of new technologies to 2041-2050, S2 foresees some deployment of these technologies in 2030-2040, while S3 relies heavily on the assumption that deployment of novel low carbon technologies such as hydrogen production by electrolysis, carbon capture and use and industrial carbon removals can be quickly deployed between 2031 and 2040.
Of interest to the food and agricultural community is a further variant (LIFE) that allows an assessment of the sensitivity of the scenario analyses to assumed societal trends that can change the future evolution of GHG emissions. Its purpose is to illustrate how demand-side actions can complement the supply-side technology deployment analysed in the core scenarios. Only in this variant scenario do we see changes in food production taking place.
For the food system, LIFE assumes that consumers gradually shift to healthier and more sustainable diets, while production follows the Farm to Fork Strategy and Biodiversity Strategy objectives, in particular reducing nutrient surplus and fertilisers needed to bring nature and biodiversity back to a healthy state and reducing food waste. Specifically, LIFE introduces a 25% shift towards the suggested EAT-Lancet Commission diet as well as a reduction in food waste. The analysis does not make assumptions on the drivers for these shifts in consumption patterns, which can be the result of societal trends, changing social norms and preferences, voluntary actions, or incentivising policies.
Implementing the scenarios
The targeted emission reductions in 2040 in each of the three scenarios are reached in the models using modelling drivers. These can take the form of assumptions of explicit policy outcomes imposed exogenously, such as targets of CO2 performance standards for cars and vans each year. Alternatively, they can be induced by modelling drivers such as carbon values applied to the different sectors. These values could be explicit carbon prices or regulatory incentives that alter investment decisions towards abatement of GHG emissions that are converted into an equivalent carbon value. They represent the marginal abatement cost per ton of CO2e covered in the respective scenario. Table 1 shows the carbon values used in the different scenarios in the impact assessment. These carbon values are then combined with information on the Marginal Abatement Cost Curves in these sectors to estimate the likely emissions reduction that can be achieved.

To achieve its 2040 target, scenario S1 relies on the application of a carbon value on CO2 from fossil fuel combustion and industrial processes and on the effect of known policies affecting non-CO2 GHG emissions by that time horizon. For agriculture, the emissions trajectory in S1 results solely from: a) the agriculture policy as reflected in the EU Agricultural Outlook 2022; and b) relevant existing and proposed legislation, particularly the proposal for a revised Industrial Emissions Directive (although the agricultural elements in this Directive were largely removed in the final compromise). Other policies that could enable the implementation of extra practices and technologies are not considered.
Scenario S2 equalises the carbon values applied to CO2 from fossil fuel combustion, industrial processes and all non-CO2 emissions associated with energy, industry and waste, while applying the same carbon value in agriculture as in the LULUCF sector (this is actually €50/t CO2e in S2 so there may be a misprint in the previous table). This stimulates additional emissions reduction in agriculture as there is now an incentive to use additional practices and technologies. Scenario S3 equalises the carbon values applied to all sectors and stimulates a further reduction in agricultural emissions. The figures in the LIFE scenario in Table 1 are discussed later in the post.
Sectoral pathways in the scenarios
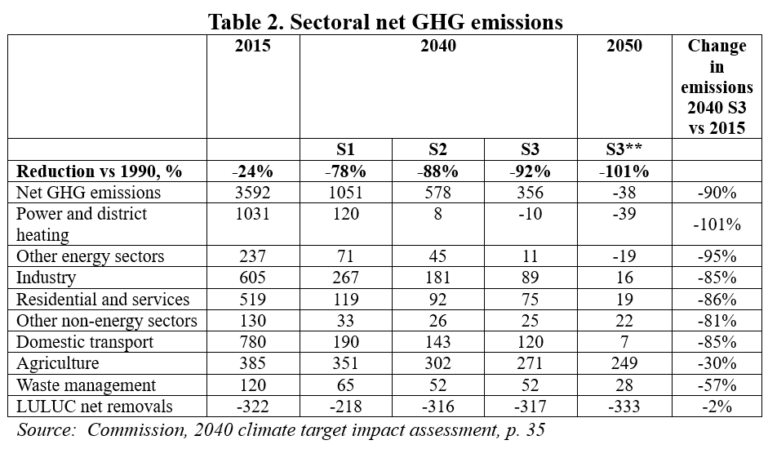
Table 2 shows the projected total and sectoral emissions reductions achievable in each of the three scenarios based on the modelling drivers assumed. Under scenarios S1 and S2, there are net emissions in all sectors in 2040 partially offset by net removals in the LULUCF sector. In the most ambitious scenario S3, the energy sector becomes net zero thanks to the adoption of industrial carbon removal technologies. Agricultural emissions would account for 43% of gross emissions in 2040 in that scenario (76% of net emissions including LULUCF).
The final column shows the projected change in sectoral emissions between 2015 and 2040 under the assumptions of scenario S3. Here we see the projected 30% reduction in agricultural emissions which was dropped from the leaked draft of the Commission Communication. The extent of ambition for the agricultural sector in scenario S3 can be seen by comparing the 30% reduction with expected reductions under current policies, which are shown in Table 3. A reduction of just 9% by 2040 is foreseen, underlining the need for significant additional measures to achieve the modelled trajectory.
The projected net removals in the LULUCF sector are also worth underlining. Here, the model projections calculate that net removals in Scenario S1 (without additional LULUCF incentives) will be 218 Mt CO2e. This compares to the legislated target of 310 Mt CO2e in 2030. Additional incentives compared to current policies will be required even to maintain this level of net removals in the LULUCF sector up to 2040.

Impact of the LIFE scenario
The three scenarios considered all focus on supply-side changes, changes in the way goods and services are produced. The LIFE scenario examines the potential impacts of a shift towards more sustainable lifestyles. For the food sector, LIFE assumes changes in the food system in terms of dietary changes, food waste reduction and a gradual implementation by 2040 of the objectives of the Farm to Fork Strategy (these latter are not demand-side measures but are implemented in addition to changes induced by the carbon values shown in Table 1). These demand-side changes could go hand in hand with any of these scenarios but are modelled in the impact assessment as a variant of scenario S3.
Table 4 summarises the impact of the LIFE sensitivity analysis on GHG emissions in the S3 scenario. By construction, the case achieves the same reductions in net GHG emissions as S3, but through a different distribution of emissions across sectors. Implementing demand-side measures replaces some of the reductions that would otherwise need to be found through additional supply-side changes. As a result, the carbon values needed to induce the necessary changes in other sectors are reduced (see Table 1).
The difference of emissions in LIFE compared to S3 results from a more sustainable food system and associated land use. Building on a shift to healthier diets and more sustainable practices, LIFE leads to complementary changes in the agricultural land area. Some land can be freed up from livestock, growing fodder and intensive grazing and converted into extensive grassland, high diversity landscape features with – in comparison to S2 and S3 – more natural vegetation, forest land and rewetted organic soils. This change in land use is accompanied by a reduction in nutrient surplus and use of pesticides, and an increase of organic farming in line with the Farm to Fork Strategy. This reduces the net emissions from the land sector by about 100 MtCO2e, including a cut in emissions from agriculture of about 60 MtCO2e and significant additional removals from the LULUCF sector of around 40 MtCO2e in 2040. This lowers the need for carbon capture and industrial carbon removals in the core scenarios.

Implications for the agricultural sector
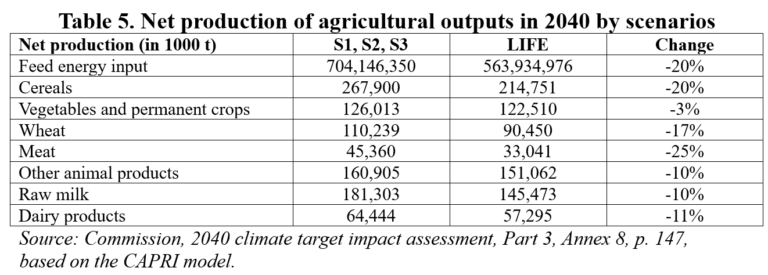
By construction, implementation of the three core scenarios has no impact on food production, or on the composition of food production in the EU in 2040 relative to S1 which assumes no measures to reduce agricultural emissions are introduced additional to current policies. Specifically, the reduction in agricultural emissions in scenarios S2 and S3 relative to S1 (including a significant reduction in methane emissions) is achieved without any reduction in livestock output. Food production changes only in the LIFE variant, shown in Table 5.
Livestock and associated feed production decreases, reflecting a reduction in livestock density, due to the declining demand for meat and dairy products, the implementation of the objective to reduce nutrient losses by 50%, and to a limited extent to a reduction of food waste. To maintain food production unchanged as carbon values are increased must require significant changes in relative prices and thus farm incomes in the models, but these are not reported in the impact assessment. The impact assessment only reports the impact of the LIFE variant compared to scenario S3. Based on the CAPRI model, it estimates it would lead to a decrease in 2040 by -5.4% of the total revenues, most pronounced in meat production (-12% to -20%), while other activities such as vegetables and permanent crops benefit (+12%).
Cost estimates
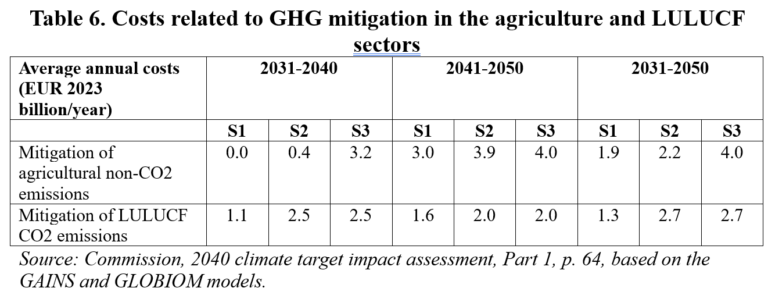
Table 6 provides an overview of the average annual costs for the projected emissions reductions in the agriculture and LULUCF sectors for the two decades from 2030 to 2050. The costs relate to the implementation of abatement technologies or nature-based removal solutions. Annual costs are generally higher in the second decade because more of the technical available potential for nature-based removals and mitigation measures has been used up and more expensive options need to be brought on stream. A somewhat puzzling feature of the table is that the average annual costs shown for the entire period can be higher than the average annual costs in either of the two decades individually.
Average annual costs for both sectors in the preferred S3 scenario amount to around €6 billion per year throughout the period. The key political economy issue for politicians to decide is who is going to bear this cost. Should farmers be subsidised to undertake mitigation measures through the CAP, and if so, will this simply redirect existing transfers to farmers or would the funding be found to increase the CAP budget so that existing transfers to farmers can be continued? Or would farmers be expected to pay for these measures themselves, under the polluter pays principle, as a result either of regulation or the introduction of market-based measures to put a price on emissions? These questions will be central to any discussion on setting a target for reductions in agricultural emissions in the 2040 climate target debate.
Conclusions
The purpose of the Commission’s 2040 climate target Communication was to propose a 2040 target that would ensure a pathway to net zero emissions in 2050 while meeting the various criteria set out in the European Climate Law. The Commission’s preferred target is scenario S3 which would realise a net 90% reduction in emissions compared to 1990. The impact assessment accompanying the Communication sets out a model-based pathway showing projected sectoral emissions that would achieve this target. This pathway assumes very rapid deployment of novel carbon removal technologies already in the coming decade. It also assumes a 30% reduction in agricultural emissions by 2040 relative to 2015. The assessment shows how demand-side measures, including changes in diets and a reduction in food waste, could contribute to reducing the challenge facing the energy and industrial sectors and reduce the need for reliance on novel carbon removal technologies. A further impressive Annex in the impact assessment, not discussed in this post, presents estimates of the cost of inaction, assessing the consequences of climate change if there is only limited mitigation at global level.
The impact assessment is an impressive achievement by the Commission services including the Joint Research Centre, but there are some weaknesses that should be addressed before or when the legislative proposal to set the target is published.
We need a much more thorough assessment of the likely impacts of the 2040 preferred target on the agricultural sector. This impact assessment takes an economy-wide view, and it is understandable that it cannot dig down into sectoral details (even if there is significant discussion of the mitigation potential in agriculture and the marginal costs of realising that potential). But the apparent modelling decision to keep levels of food production constant across the scenarios (assuming that I have understood the methodology correctly, if not, I hope someone will be able to put me right) is a puzzling decision. It just seems inconsistent to suggest that the cost of agricultural mitigation could be up to €4 billion annually and yet agricultural production would remain unaffected. The impacts of demand-side changes in the LIFE scenario on farm revenues and production are modelled using the CAPRI model and reported, but the implications of moving from scenario S1 to scenarios S2 and S3 (possibly modelled using the GAINS model which is not so suited to calculating production and revenue effects) are not assessed. Farmers are central to mitigation actions, and a strong analytical foundation is needed on which the necessary discussions can take place.
There are many references throughout the Communication and the impact assessment to the need for a Just Transition. This is primarily interpreted through the eyes of consumers, with a view to the likely impact on fuel expenses, energy and transport poverty and the distributional impacts of changes in energy and transport related expenses on households. There is also discussion of employment and regional impacts, but here the focus is on mostly on regions dependent on coal or automobile production.
There is a recognition that “The need to maintain and enhance LULUCF net removals and to curb GHG emissions from the agriculture sector will mostly affect rural regions” (IA; Part 1, p.70). But the related text is not very informative. “Territories where agriculture plays a major role and where associated emissions are currently the highest will have to achieve a larger deployment of technologies and practices to reduce GHG emissions in S2 or S3 than in S1. A shift in society towards a healthier and more sustainable food system, as in LIFE, means a higher uptake of more extensive farming practices with opportunities to generate revenues from nature-based removals activities”. Stakeholders deserve to know in much more granular detail what these changes will mean in specific regions and localities and for specific types of farmers.
Finally, setting targets, also sectoral targets, is only the very beginning of policy development. After this comes the hard work of designing effective instruments and incentive structures to achieve these targets. Will the task of reducing agricultural emissions be left to the opt-in voluntary model based on offering subsidies for mitigation actions through the CAP, will it require regulatory action, and what role will be there for market-based instruments such as trading schemes and carbon farming? And, as I hinted above, behind these design issues is the fundamental question who is going to pay for these activities. These are difficult questions, but they should be central to the ongoing Strategic Dialogue on the Future of Food.
This post was written by Alan Matthews.
O artigo foi publicado originalmente em CAP Reform.


