


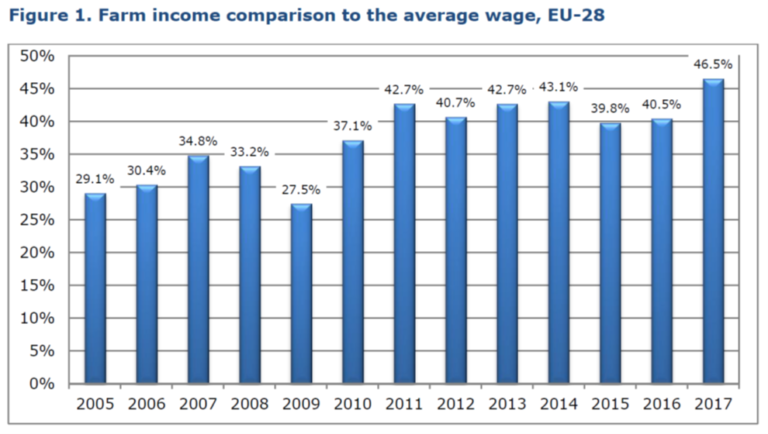
One of the objectives for EU agricultural policy set out in the Treaty of Rome (now the Lisbon Treaty) is to ensure a fair standard of living for the agricultural community, in particular by increasing the individual earnings of persons engaged in agriculture. In its Communication The Future of Food and Farming in November 2017 that launched the public consultation phase of the current CAP reform, the Commission included a graph comparing average farmer income with average gross wages and salaries in the total economy to make the point that farmers’ income is still lagging behind salaries in the whole economy. Thus it concluded that “direct payments [that partially fill the gap between agricultural income and income in other economic sectors] remain an essential part of the CAP in line with its EU Treaty obligations”.
The Commission continues to use this comparison in support of its argument that direct payments are necessary to close this perceived income gap between farm and non-farm incomes. For example, the figure below, taken from this DG AGRI brief on Specific Objective (a) Ensuring Viable Farm Income, one of the nine Specific Objectives in the draft CAP Strategic Plan Regulation, compares entrepreneurial income in farming per family work unit to average wages and salaries over time. I have argued previously that this is better interpreted as a comparison of average labour productivity rather than living standards, although this is not fully correct either as entrepreneurial income (also known as family farm income) includes the return to family-owned assets such as land and capital and not only labour. The return to labour alone would be lower than what these figures suggest.
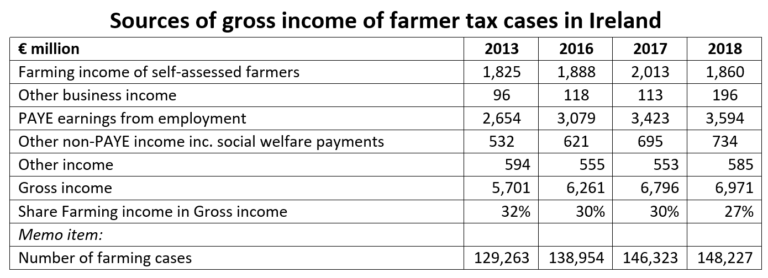
The main reason highlighted by economists why the favoured DG AGRI measure is not an appropriate comparison of living standards is that it disregards other income accruing to the farm household that can be important for its economic well-being. The following table shows the importance of non-farm income to farm households using Irish tax data. For farmer tax cases in Ireland (that is, all taxpayers that return income from farming or are otherwise listed in a Ministry of Agriculture database and treating jointly assessed couples as a single unit) their farming income is less than a third of their total household income. These figures probably underestimate the importance of non-farm income in farm household income because some spouses will opt for separate assessment. In that case the non-farm income of the non-farming spouse will not be captured. If the objective is to ensure an equal standard of living for farm households, non-farm income cannot be ignored.
Comparing farm and non-farm household incomes
Some conceptual issues in making these comparisons first need to be clarified. There are three main questions:
- Who do we define as the farm population? Traditionally a distinction is made between a broad and a narrow definition of farm households. The broad definition includes all families who have some self-employment income from farming, even if it accounts for only a small share of their income. The narrow definition focuses on those for whom farming is their main source of income (i.e., accounting for at least half of their total household income).
- What is the appropriate comparator group? Here the choice can be between average wages and salaries for employed workers, the group of non-farm self-employed (again, defined as those for whom a majority of their factor income comes from non-farm self-employment) or all those in the population except for the farm group (broadly or narrowly defined).
- How do we define household income? The favoured variable is net disposable household income thus including every form of income but after taxes. This is usually converted to equivalised income per household member (a typical equivalence scale equals 1 for the reference person, 0.5 for other adult members (fourteen years old or elder) and 0.3 for members up to thirteen years old). However, studies differ in whether they include non-monetary income, such as the imputed value of owning one’s own home or consumption of home-produced produce, in their definition of income.
To make a comparison of farm and non-farm household incomes requires data on individual household incomes. There are two sources of such data. De Frahan and his colleagues in a 2017 paper make use of the Luxembourg Income Study database which harmonises socio-demographic, expenditure and income data that are collected at the household level through national household-based budget surveys submitted by national statistical offices around the world. The LIS data are only suitable for cross-sectional analysis as households cannot be linked across years. This data source has become less useful over time as national surveys have ceased to separate incomes from farm self-employment from other self-employment. As well as providing a thorough overview of previous studies, these authors concluded on the basis of thirty years of data for ten OECD countries that low income is no longer a chronic problem among farm households in any of the ten surveyed OECD countries. At country level, average incomes of farm households are close or greater to those of non-farm households in most of the surveyed OECD countries since the 1970s.
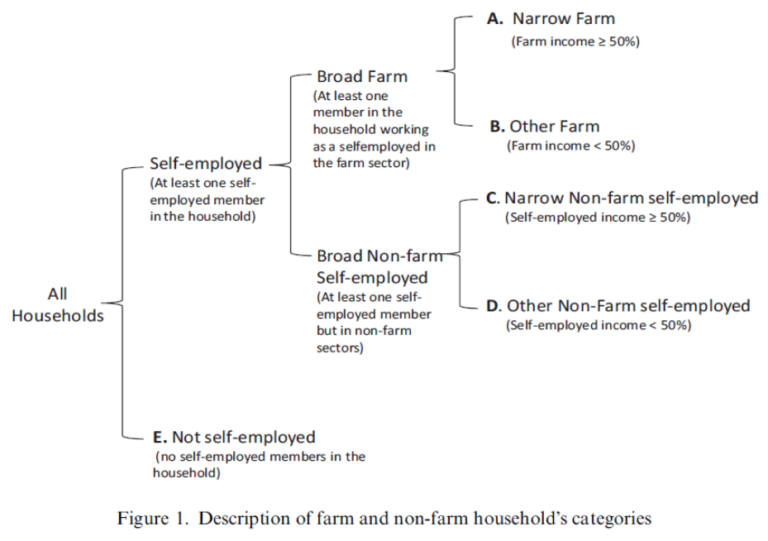
Three Italian economists Maria Marino, Benedetto Rocchi and Simone Severini have instead made use of the Eurostat Statistics of Income and Living Conditions (SILC) in two recent papers (Rocchi, Marino and Severini 2020 and Marino, Rocchi and Severini 2021) to explore income differences between farm and non-farm households. In this post, I want to highlight the results of their more recent paper. In this paper, they divide the total sample of households into different classes (distinguished by different letters) as shown in the following diagram. This allows them to make different comparisons between broad and narrow definitions of farm households and between non-farm self-employed households and all non-farm households.
Their data comes from the SILC survey for the years 2004-2015 for 22 out of 28 EU Member States (some countries are missing because variables to identify farm households are missing). On average, the yearly total number of EU families represented by the total sample is about 202 million. Represented farm households are respectively about 6 million according to the broad definition and 2 million according to the narrow definition. Countries included are divided into Old (OMS) and New Member States (NMS) based on date of accession after 2014. The raw (unadjusted) average equivalised income levels are shown in the following table for different household categories (coded using the letter categories in the previous diagram). Income is defined with and without non-monetary income (the latter is included in extended income). Recall that these results are derived from survey data so there is some sampling uncertainty around the averages. However, all income differences between farm and non-farm groups are statistically different than zero.
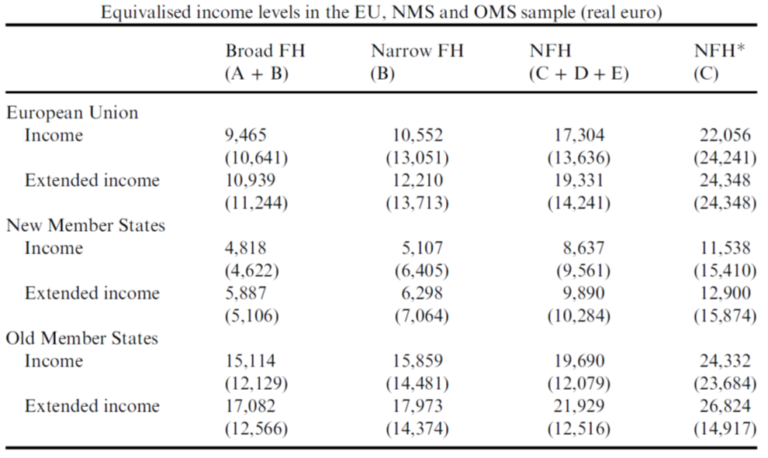
To summarise, the income of narrowly defined farm households is generally higher than for broadly defined farm households although the differences are not striking. However, in general farm household income is much lower than that earned by non-farm households and is less than half that earned by non-farm self-employed households. These results support the conclusion that farm households have not yet achieved the same standard of living as non-farm households.
Controlling for different characteristics in the two groups
Using the details in the SILC survey, there are significant differences in some observed characteristics of farm and non-farm households. Farm households are older, less educated, more likely to live in rural areas, have larger family size, and it is more likely that the household head is male, among other things. This raises the question, how much of the observed differences in average incomes is due to the sector effect (whether the household is self-employed in farming or not) and how much is due to these other observable characteristics that differ between the two groups.
In their more recent article, the Italian researchers control not only for differences in these observable characteristics but also for unobservable differences between the two groups. To identify the sector effect, one would like to design an experiment where households are randomly assigned to work in the farm or non-farm sectors. This is obviously not possible. Researchers must work with observational data where households have already decided on their occupation. In this situation, researchers face the problem that they cannot observe what either group of households would have earned if it had belonged to the other group.
A way around this is to create a control group of households that has similar characteristics to the group of farming households. In their 2020 paper, the Italian authors use regression adjustment and covariate matching techniques to mimic this outcome, both of which can control for observable characteristics. However, there may also be unobservable differences between the two groups. Unobservable preferences may determine those who take up farming activities versus those who do not, attitudes to risk may differ, or the two groups may pick up different skills. In their 2021 paper, the authors exploit the longitudinal nature of the SILC dataset (the fact that households remain in the survey for more than one year) to also capture these unobservable differences.
Their basic approach is to estimate a standard income equation in which equivalised household disposable income is regressed on a set of controls generally employed among the determinants of household income, including characteristics of the householder (age, age squared, education, marital status, gender, health), while others define the household’s features (number of individuals living in the household and the type of region where living). Exploiting the panel nature of the data controls for unobservable effects. A dummy variable is included to indicate whether the household is a farm or non-farm household. The purpose of the estimation strategy is to determine the magnitude and sign of the coefficient on this variable. A statistically significant negative coefficient indicates that the conditional mean income of farm households (i.e. the average income once all the other differences are controlled for) is lower than the conditional mean for non-farm households and would be evidence of a pure sector effect.
When looking at broadly defined farm households, the authors find that a negative income disparity exists between farm and non-farm households but except in the NMS the conditional differences are not significant. When the focus is put on narrowly defined farm households, the authors find that they are better off on average than non-farm households in all samples controlling for differences in characteristics except when extended income is included in the NMS. Finally, in no sample is there a significant income gap when comparing the group of narrowly-defined farm households with self-employed non-farm households, again once when the different characteristics of the two groups are taken into account.
Discussion
What are the policy implications of these findings? The authors argue that, because CAP support is channelled through decoupled direct payments that are paid to all farm households (including those for whom farming is only a secondary source of income), it effectively over-compensates those farm families who are mainly dependent on farming income whose income level is higher than the average of the non-farm population. They question whether these payments are effectively targeted to support the farmers who experience a relevant income gap. Note, however, that in practice even narrowly-defined farm households have an average income much lower than non-farm households. It is only when account is taken of differences in characteristics between the two groups that parity in income is achieved or exceeded.
In any case, leaving aside practical questions of how these groups might be identified, it would clearly be hard to justify shifting CAP money from farm families that are mainly dependent on farming to households in which income from farming is only a minor part of their total household income (against the background of the debate that CAP support should be allocated to “genuine” or “active” farmers). If the objective is to raise the average income of specific households or to reduce the risk of poverty, this should be pursued through social policy rather than sectoral policy.
Should more attention be paid to the ‘raw’ data that show a significant gap still exists between farm and non-farm household incomes? Or to the conditional mean differences that explain these differences as due entirely to observable and unobservable differences between the two populations and, once we control for these differences, narrowly-defined farm households even have a higher average income than comparable households?
If we are interested in comparing standards of living, does it help to say to a farm family, we can see that you have a low income, but this is because of your ill-health, your low level of education and because you are female. Taking your circumstances into account, you are no worse off than non-farm households in similar circumstances.
One might still want to argue, particularly because there is no evidence of a sectoral effect, that it is more appropriate to address this family’s low income situation through social transfers rather than agricultural policy. Or agricultural policy could be used to address these underlying causes of household income differences, such as rural development policies supporting the entry of young farmers or professional training, and promoting social inclusion and economic development in rural areas (Rocchi et al, 2020).
Policies in the latter group will contribute to closing the productivity gap but they will take time to have an effect. And while social transfers can be more targeted and are vastly more efficient in addressing low incomes and poverty than a sectoral agricultural policy, the problem in many countries, particularly in Central and Eastern Europe, is that these transfers remain at very low levels due to budgetary constraints. If the EU budget could finance social transfers, it would be easier to make the argument that CAP income transfers should be replaced by social transfers. But for low income farm households in poorer EU Member States, the alternative to CAP income support may be no support at all. This is part of the reason why a World Bank report in 2017 found that, for countries it labelled as ‘incomplete transformers’ (where agriculture is highly correlated with poverty), both CAP Pillar 1 decoupled payments and Pillar 2 rural development payments had contributed to poverty reduction.
One might add two technical comments, that work in opposite directions. The observed income of farm households includes existing agricultural support payments. On average, these payments account for around 35% of agricultural factor income and 57% of farm family income in the EU. Without these payments farm household incomes would be lower. How much lower is unclear (partly because removing these payments would have offsetting knock-on effects on input prices and factor markets, most notably land rents) and partly because, as the Irish data shown above underlines, income from farm self-employment only makes up a proportion of total income, and for broadly-defined farm households a relatively minor share. Nonetheless, we should bear in mind that statistical income comparisons between farm and non-farm households already take into account farm income support.
Another element not considered in these studies is whether there are differences in the cost of living between rural and urban areas. The original conjecture by regional economists was that prices would be higher in rural areas due to higher transport costs and more limited availability of goods. This was subsequently modified to recognise that the prices of non-tradable goods tend to fall with distance from urban centres due to congestion effects, land scarcity and other urban costs in agglomerated areas.
Comprehensive data on differences in regional prices are usually not available from government sources in the EU (see Janský and Kolcunová, 2017 for a review). More recent literature using a variety of approaches generally finds lower price levels in rural regions. Housing costs are lower in rural areas, although this is offset by higher expenditure on transport. On the other hand, lower wages often mean that various personal services tend to be cheaper in rural areas. When looking at measures such as at-risk-of-poverty, adjusting national poverty lines for differences in regional costs of living can have a significant impact on the results. When comparing farm and non-farm household incomes, this effect would work in the opposite direction to the inclusion of farm subsidies.
Conclusions
The use made of farm income comparisons to justify continued income support to the farm sector through agricultural policy has been controversial. The oft-cited evidence that family farm income per family work unit is well below average wages and salaries in the non-farm sector is criticised because it fails to consider the other income sources of farm households, which Irish data show can be substantial. It better reflects a comparison of average labour productivity in the farm and non-farm sectors, though even here it overestimates farm labour productivity because the returns to other family-owned production factors are not filtered out.
However, recent studies using household data confirm that there continues to be a significant gap also between the average household income of farm and non-farm families. This conclusion is at variance with previous studies such as Hill (2015) who concluded that “the evidence points to farmers NOT being a particularly low-income sector of society in most Member States judged on the basis of their household disposable incomes” (emphasis in the original) as well as the de Frahan et al. study quoted earlier.
However, the more recent studies also show that these differences can be entirely explained by differences in the observable and unobservable characteristics of farm and non-farm households, such that the conditional mean differences are either not statistically significant or even favour farm households when they are narrowly defined. This evidence suggests that there is no inherent reason in agricultural production per se that would depress income relative to incomes in other sectors. As caveats, I note that observed income levels for farm households already include a fair slice of farm support but, on the other hand, do not adequately control for observed lower price levels in rural regions.
It is worth noting that these conclusions are derived from the regular Eurostat SILC survey. However, with small sample sizes it is no longer possible in all EU Member States to separately identify farm households. The Commission, in its response to a critical European Court of Auditors’ report on its system for performance measurement in relation to farmers’ incomes, observed that “Given that the CAP focuses on supporting income from agricultural and rural development activities, an overall monitoring of farm household income was not a priority, nor was it feasible to include this new data collection in the statistical work programme. Instead, a specific EU survey (EU-SILC) has been designed to collect information on the standard of living of EU households.” To ensure the continued value of this survey, some CAP funds could be redirected to national statistical offices to ensure that sufficient farm households are included in the sample in future to continue to permit farm / non-farm household income comparisons to be made.
This post was written by Alan Matthews.
Photo credit: Brenden via Flickr under Creative Commons licence.


Discussão sobre este post